Mark Edwardson

Hi, I'm Mark.

My background is in civil engineering, with a focus on faster transit and safer walking & biking. I like writing code, especially when it intersects with my interest in urbanism.

I also like hiking, reading, 3D printing, Civ 6, and... more biking.

Victoria/Vancouver, BC

Download my resume.

22 year old blonde man wearing a scarf and a rain jacket. He is outside and there are trees in the background. Black and white photo.

Projects

Victoria Bus Speed Study

Python

GeoPandas

Plotly

MongoDB

Heroku

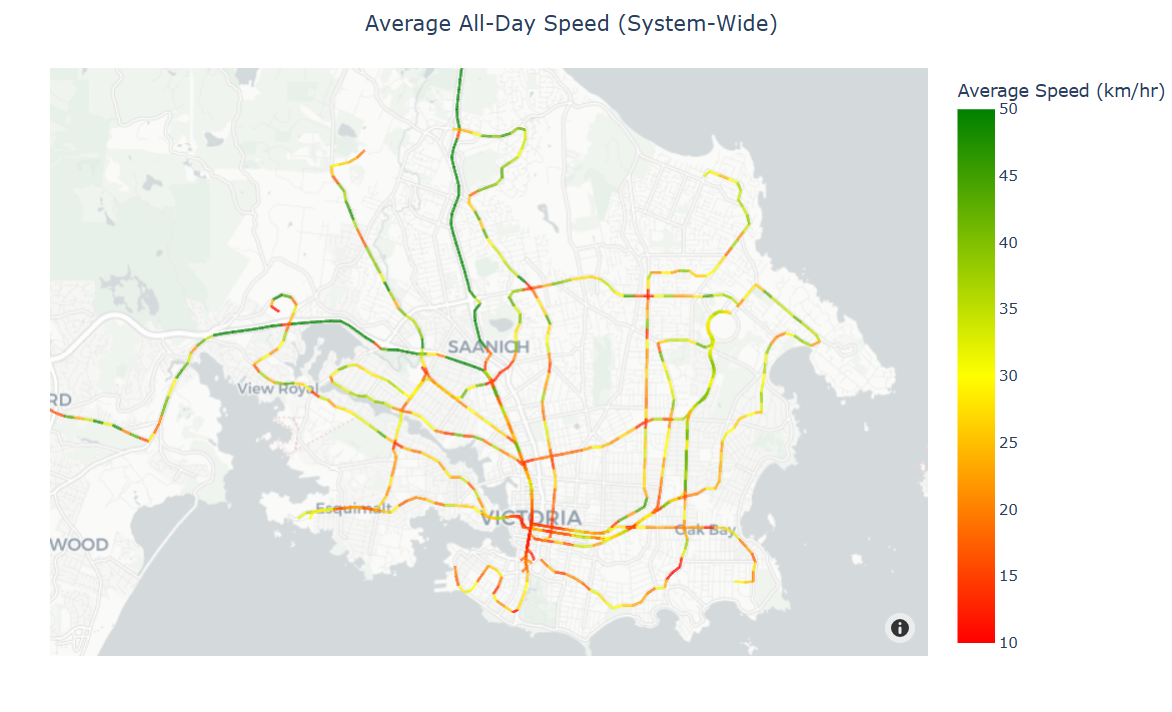
I developed dashbooard that identifies transit delay hotspots in the Capital Regional District. Behind the scenes, a tracker maintains a historical record of BC Transit's GTFS livefeed. Data is aggregated and visualized to identify routes, corridors, and intersections of concern.

This project was inspired by Translink's Bus Speed and Reliability Report, which created momentum for bus lane projects throughout Metro Vancouver.

Live Link

A map of Victoria, BC with a heatmap of bus delay hotspots.

Transit Access Maps

Python

Google Maps API

Plotly

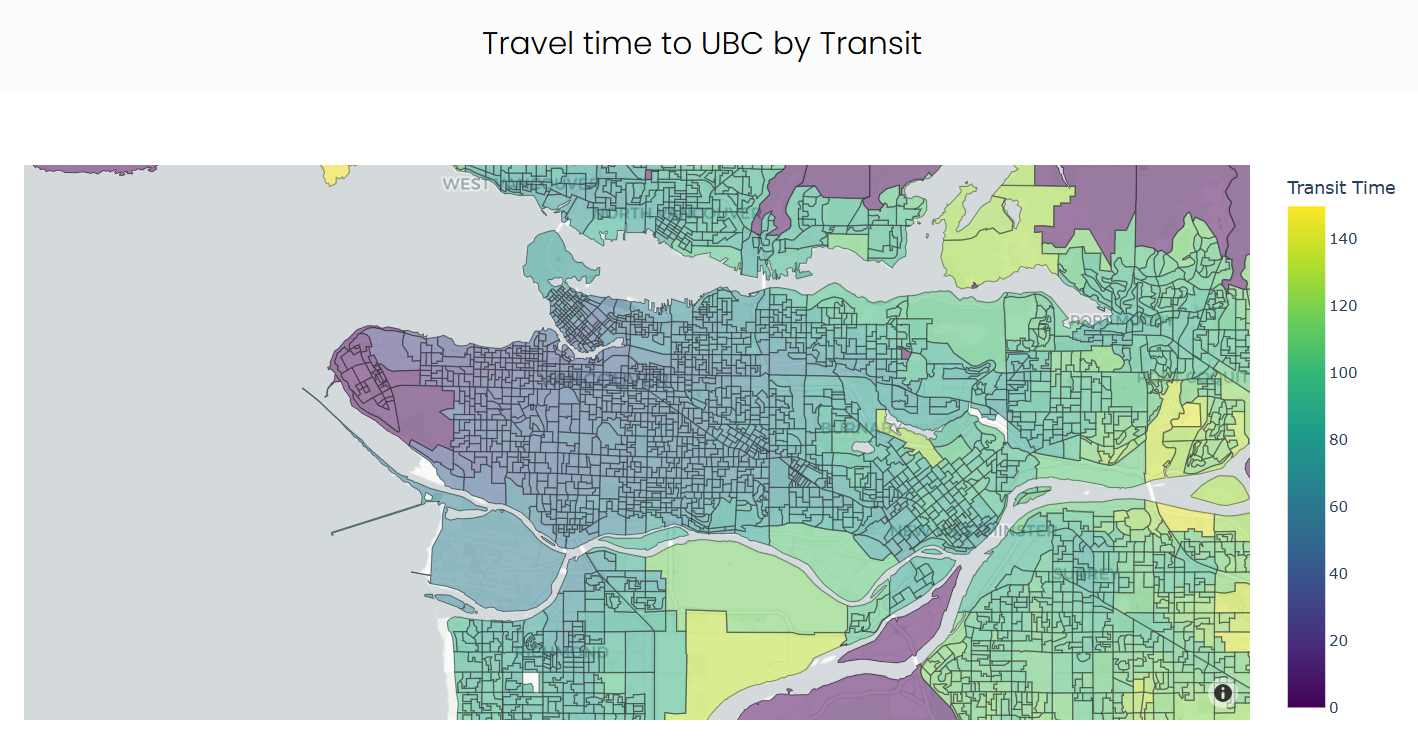
How accessible are destinations by bike, transit, and car? I used the Google Maps API to calculate travel distances to different destinations from the various census dessimination areas in Victoria and Vancouver.

Live Link

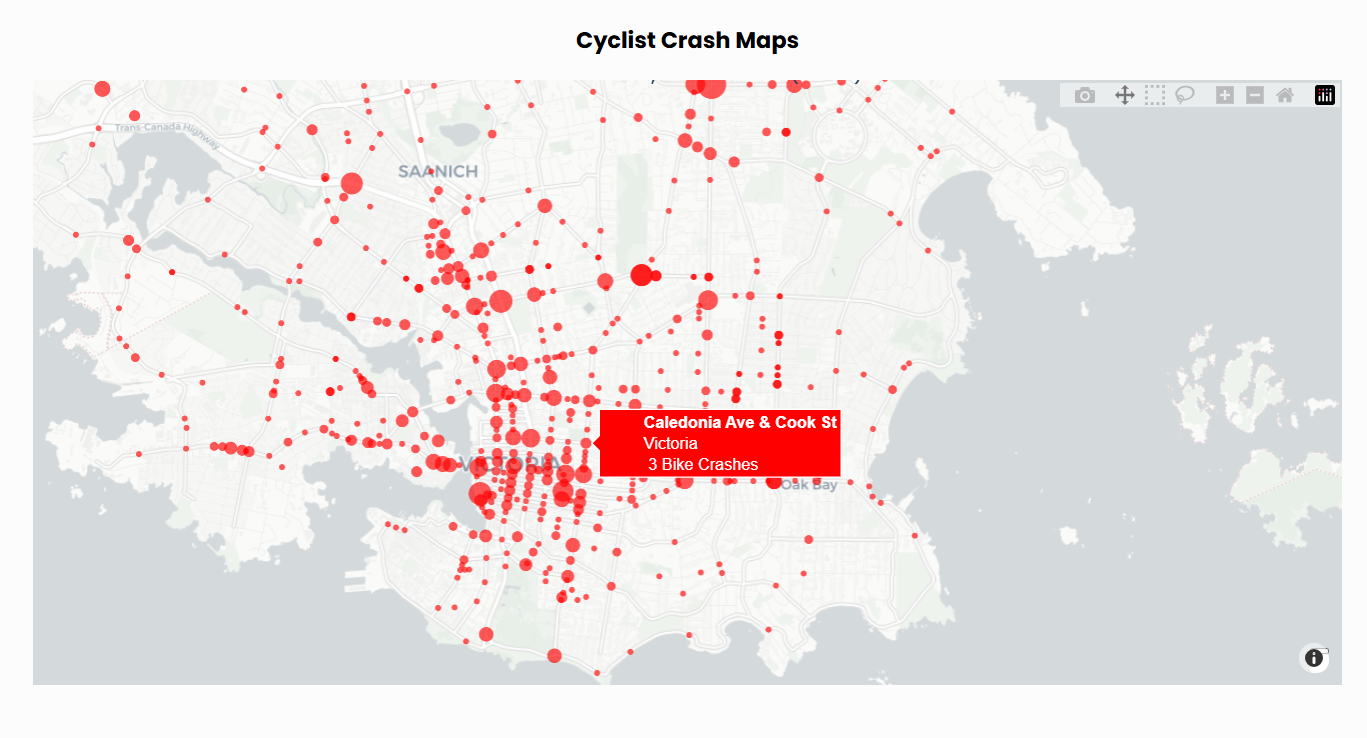
A map of Victoria, BC showing locations of bike crashes in bright red bubbles. The cursor is hovering over Caledonia Ave and Cook St, and the label shows there were 3 bike crashes.

Measuring Building Heights with LiDAR [WIP]

Python

LiDAR

Geopandas

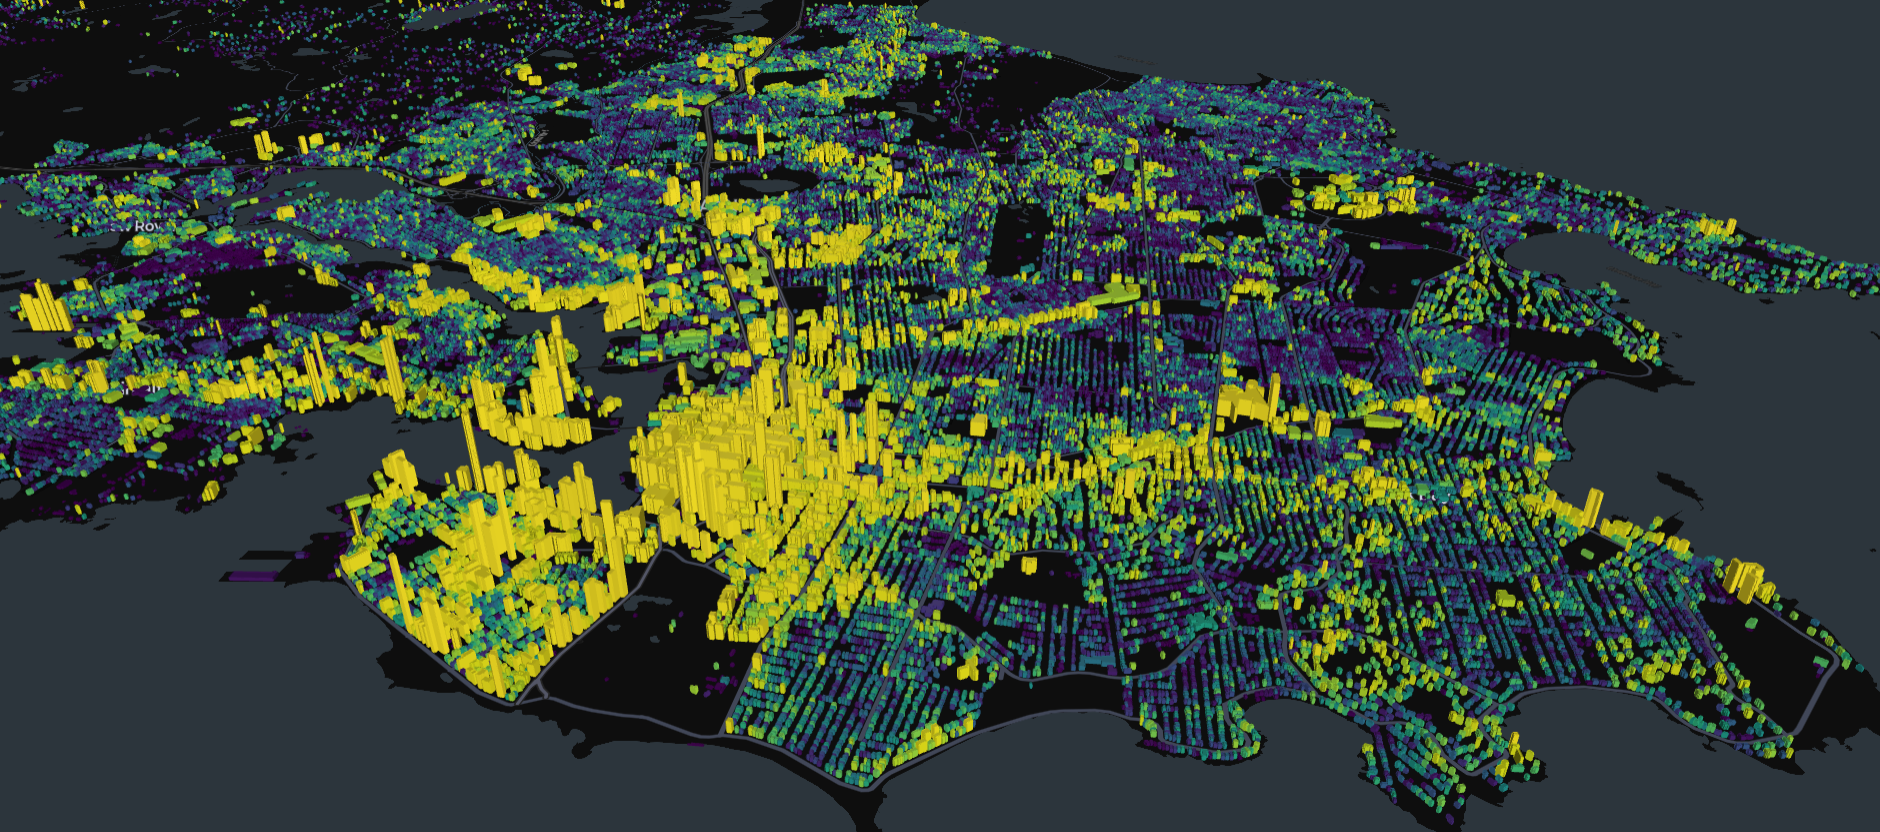
Victoria doesn't have any great helicopter photos showing where tall buildings are. Fortunately, Bing has a dataset of building footprints with heights estimated by machine learning, and BC's LiDAR portal features coverage of the CRD.

Visualizing these datasets is pretty interesting - it's a reminder that we don't build much (or any) housing in most residential neighbourhoods. It's also an opportunity to see how well Bing did at estimating building heights.

Live Link

An aerial view of a 3D model of Victoria, with building heights vertically exagerated and coloured based on height. Most tall buildings are downtown, with corridors of denser development along Fort St,  Vic West, the edge of Oak Bay, and UVic.

Better ICBC Maps

Python

Plotly

ICBC's Tableau dashboard is a great resource, but it could be prettier. I scraped the data and created a more visually appealing dashboard using Plotly.

Live Link

A map of Victoria, BC showing locations of bike crashes in bright red bubbles. The cursor is hovering over Caledonia Ave and Cook St, and the label shows there were 3 bike crashes.

3D-Printed Johnson St Bridge

3D Printing

CAD Design

Arduino

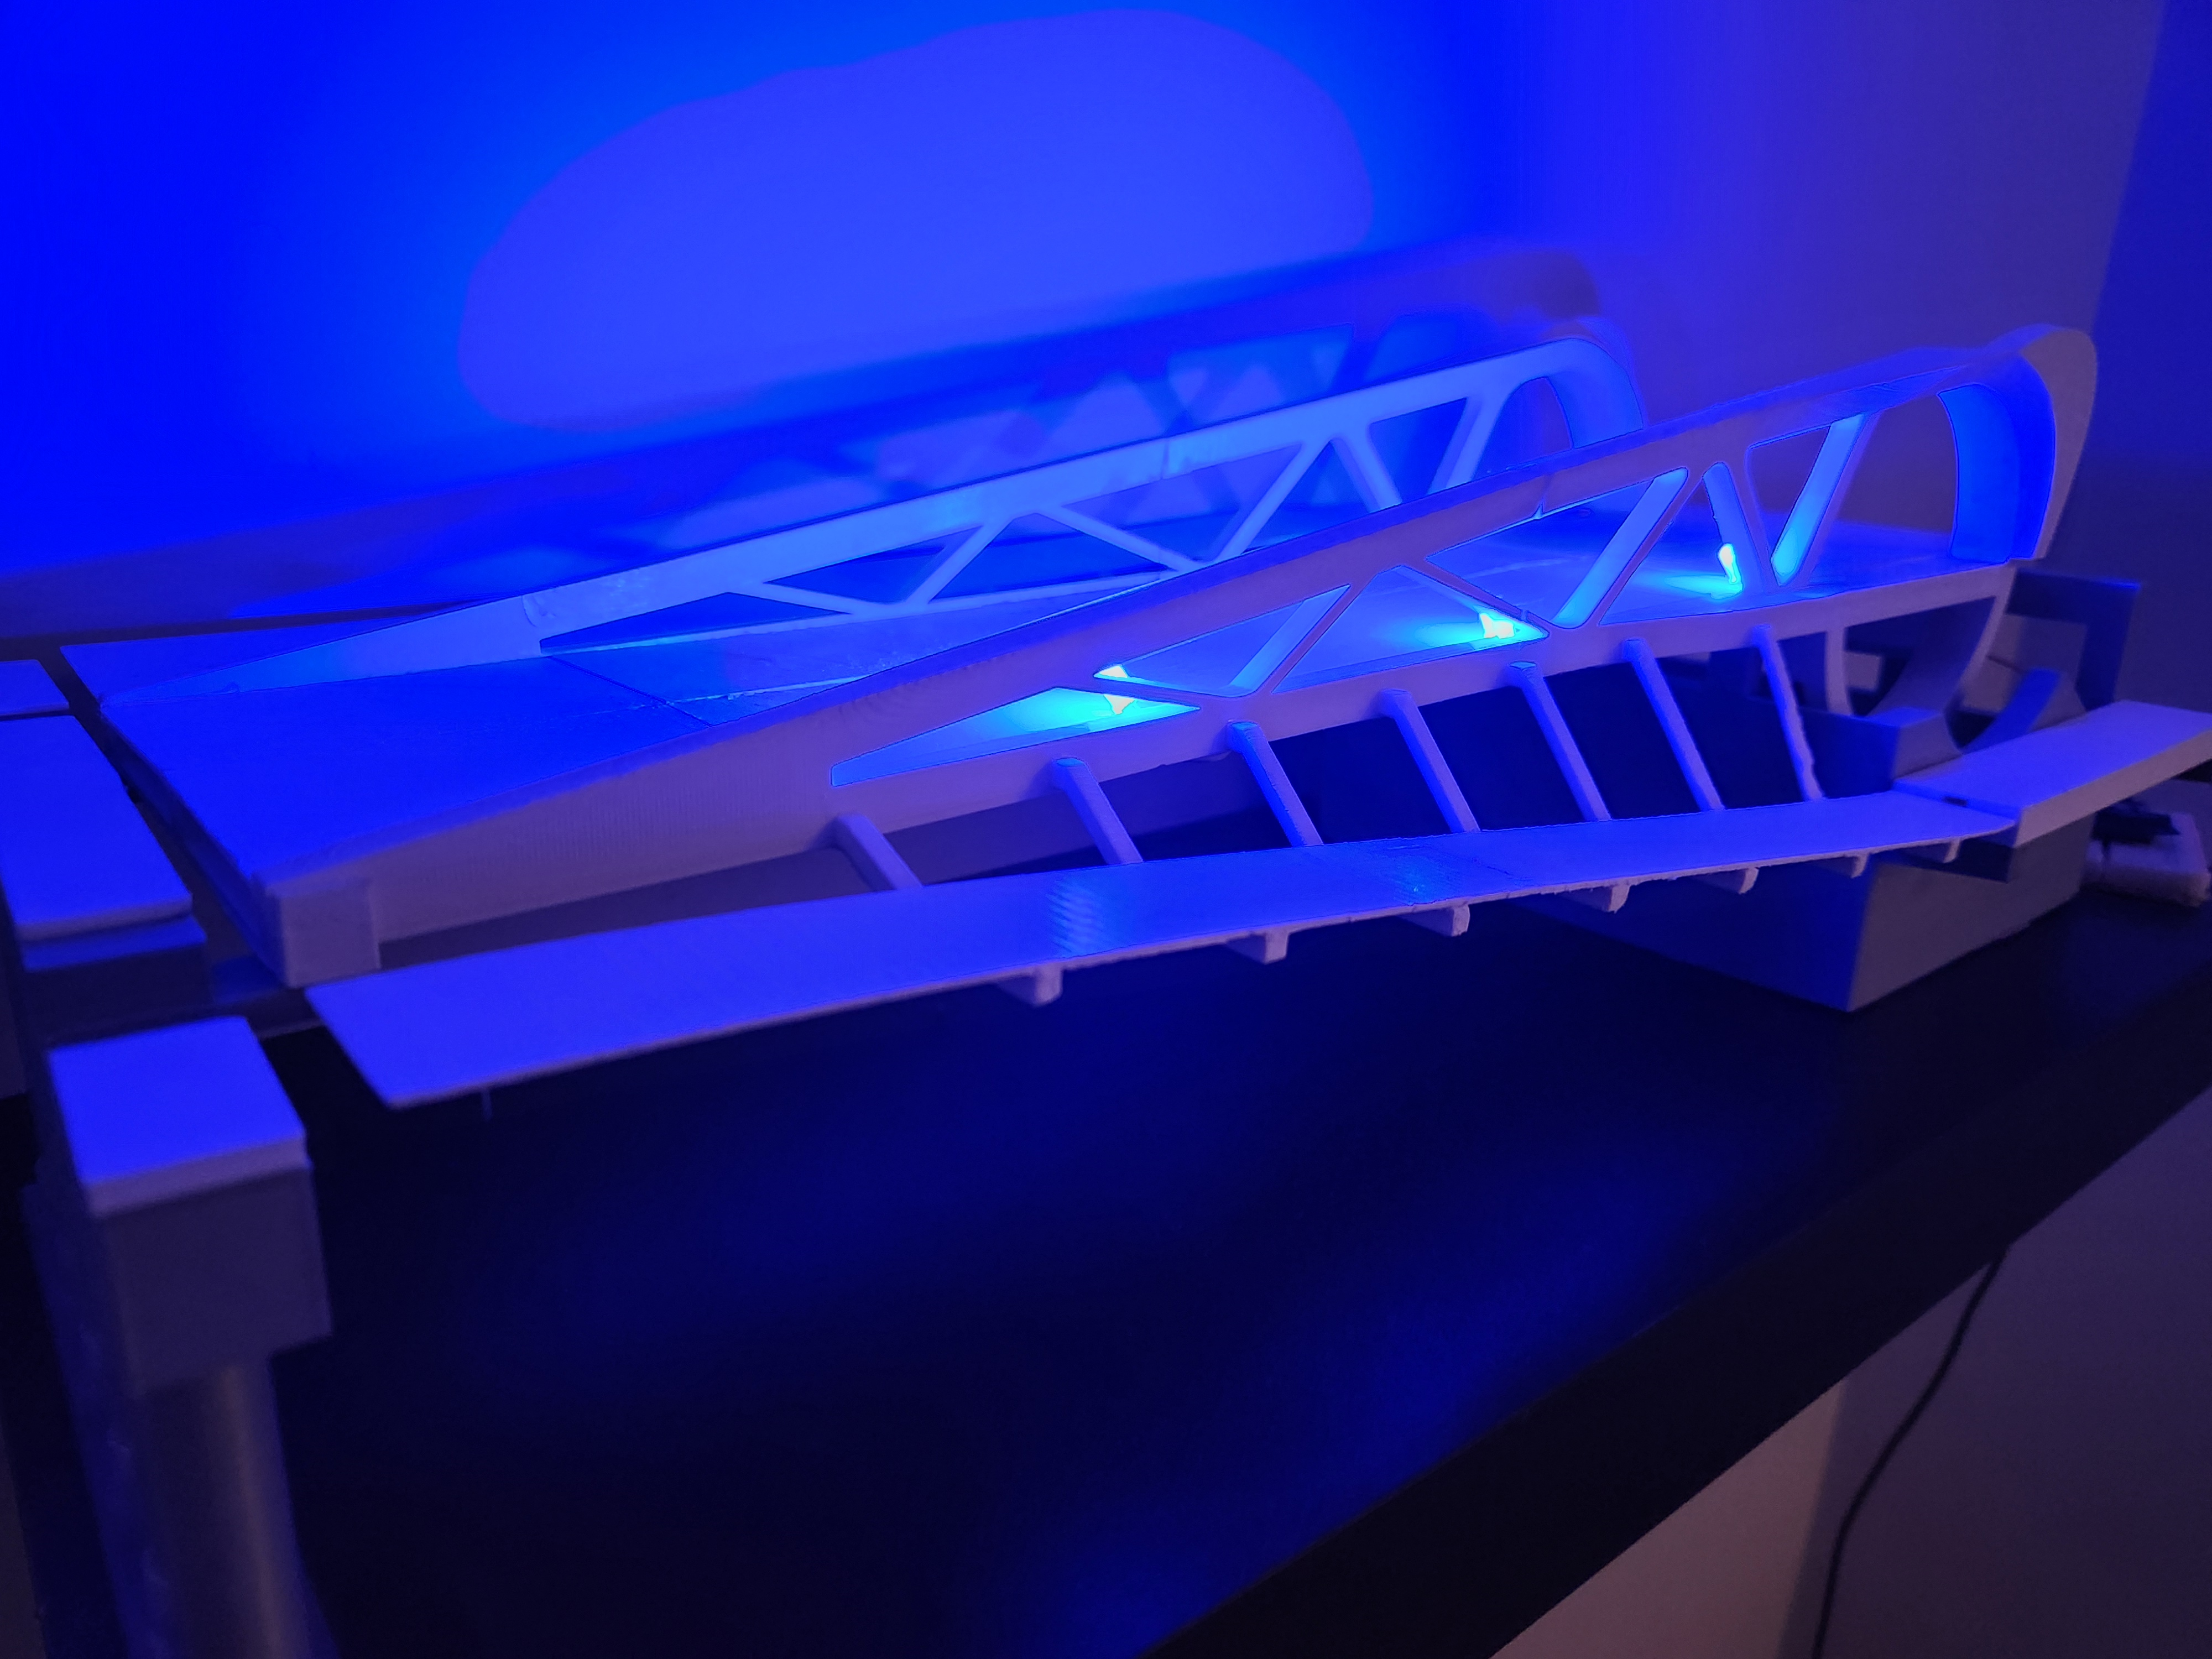
The new bridge downtown is a local icon. I modelled it in Vectorworks, a BIM CAD software, and 3D printed the different components to create a scale, working model of the bridge.

The lights are controlled by an internet-connected Arduino, which connects to my Google Home device.

A 3D printed scale model of the Johnson St Bridge in Downtown Victoria, lit up with blue LEDs.